

Industrial cleaning equipment manufacturer Tennant Company fell short of the market’s revenue expectations in Q1 CY2025, with sales falling 6.8% year on year to $290 million. The company’s full-year revenue guidance of $1.23 billion at the midpoint came in 1% below analysts’ estimates. Its non-GAAP profit of $1.12 per share was 14.1% below analysts’ consensus estimates.
Is now the time to buy Tennant? Find out by accessing our full research report, it’s free.
Tennant (TNC) Q1 CY2025 Highlights:
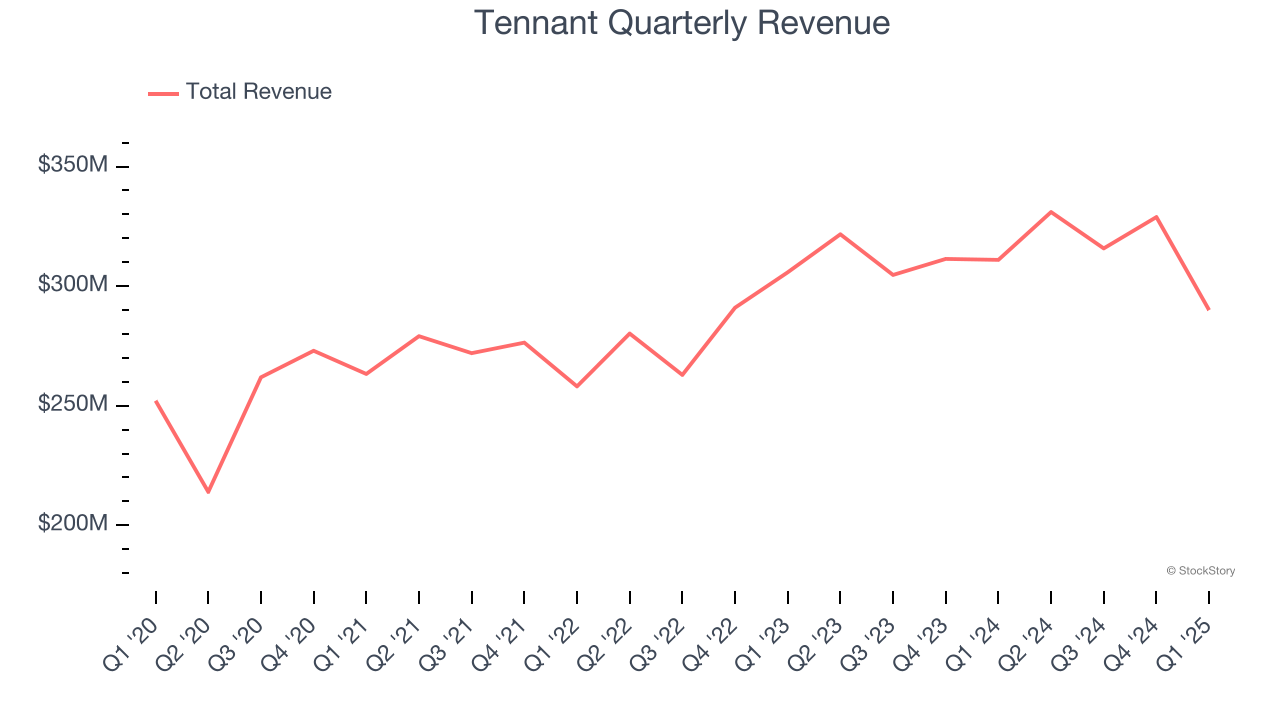
- Revenue: $290 million vs analyst estimates of $296.6 million (6.8% year-on-year decline, 2.2% miss)
- Adjusted EPS: $1.12 vs analyst expectations of $1.30 (14.1% miss)
- Adjusted EBITDA: $41 million vs analyst estimates of $48.45 million (14.1% margin, 15.4% miss)
- The company reconfirmed its revenue guidance for the full year of $1.23 billion at the midpoint
- Management reiterated its full-year Adjusted EPS guidance of $5.95 at the midpoint
- EBITDA guidance for the full year is $202.5 million at the midpoint, in line with analyst expectations
- Operating Margin: 6.8%, down from 12.1% in the same quarter last year
- Free Cash Flow was -$7.4 million compared to -$300,000 in the same quarter last year
- Market Capitalization: $1.37 billion
“We are pleased to report Tennant's first quarter results in line with our expectations. Lapping a previous record-high first quarter in the prior year, which benefited from a significant backlog reduction concentrated in higher-margin products and customers, our first quarter results reflect a return to typical seasonal patterns and product mix," said Dave Huml, Tennant President and Chief Executive Officer.
Company Overview
As the world’s largest manufacturer of autonomous mobile robots, Tennant (NYSE:TNC) designs, manufactures, and sells cleaning products to various sectors.
Sales Growth
Reviewing a company’s long-term sales performance reveals insights into its quality. Any business can experience short-term success, but top-performing ones enjoy sustained growth for years. Over the last five years, Tennant grew its sales at a sluggish 2.3% compounded annual growth rate. This was below our standards and is a poor baseline for our analysis.
Long-term growth is the most important, but within industrials, a half-decade historical view may miss new industry trends or demand cycles. Tennant’s annualized revenue growth of 5.4% over the last two years is above its five-year trend, but we were still disappointed by the results. 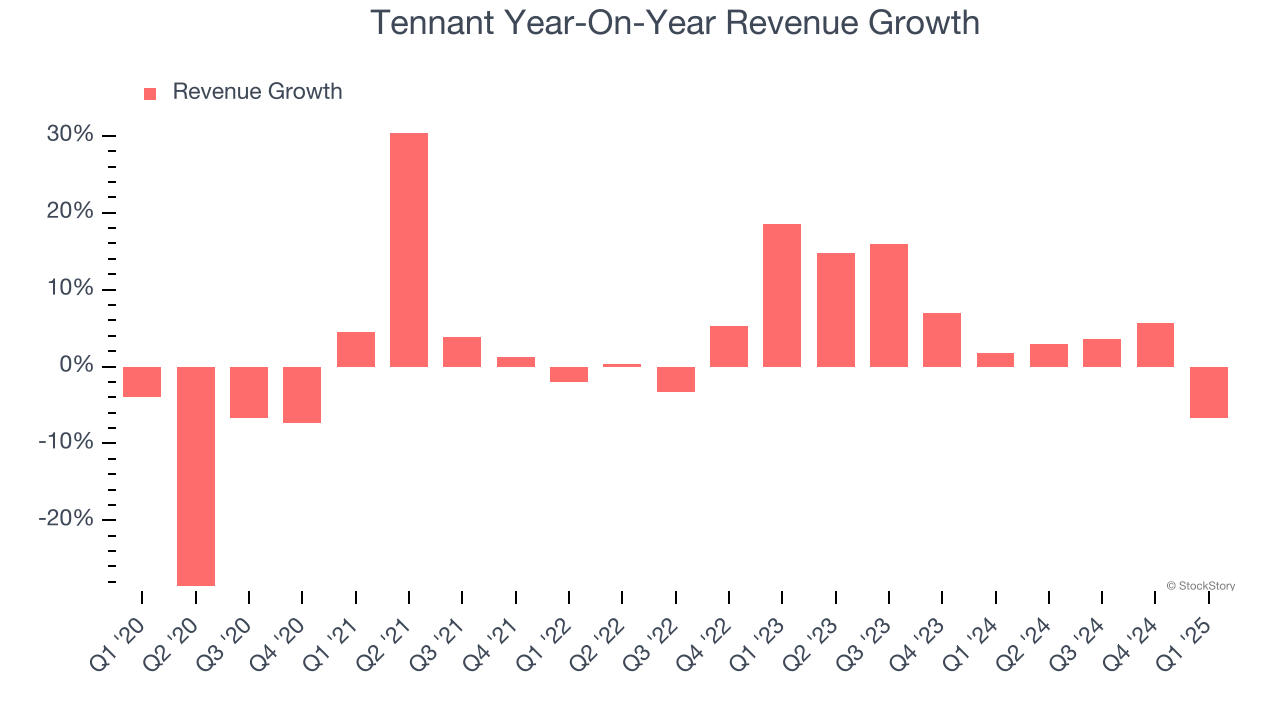
This quarter, Tennant missed Wall Street’s estimates and reported a rather uninspiring 6.8% year-on-year revenue decline, generating $290 million of revenue.
Looking ahead, sell-side analysts expect revenue to decline by 1% over the next 12 months, a deceleration versus the last two years. This projection doesn't excite us and indicates its products and services will see some demand headwinds.
Unless you’ve been living under a rock, it should be obvious by now that generative AI is going to have a huge impact on how large corporations do business. While Nvidia and AMD are trading close to all-time highs, we prefer a lesser-known (but still profitable) stock benefiting from the rise of AI. Click here to access our free report one of our favorites growth stories.
Operating Margin
Operating margin is an important measure of profitability as it shows the portion of revenue left after accounting for all core expenses – everything from the cost of goods sold to advertising and wages. It’s also useful for comparing profitability across companies with different levels of debt and tax rates because it excludes interest and taxes.
Tennant has done a decent job managing its cost base over the last five years. The company has produced an average operating margin of 9%, higher than the broader industrials sector.
Analyzing the trend in its profitability, Tennant’s operating margin might fluctuated slightly but has generally stayed the same over the last five years. This raises questions about the company’s expense base because its revenue growth should have given it leverage on its fixed costs, resulting in better economies of scale and profitability.
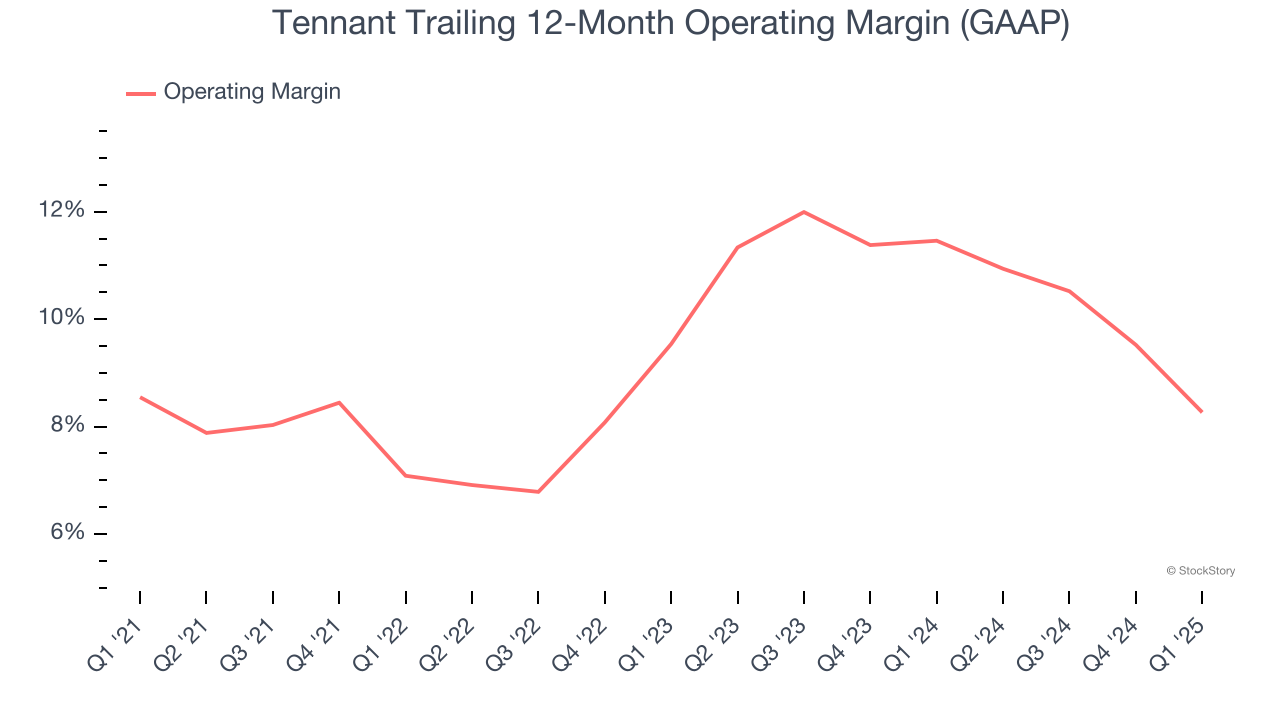
In Q1, Tennant generated an operating profit margin of 6.8%, down 5.3 percentage points year on year. Since Tennant’s operating margin decreased more than its gross margin, we can assume it was less efficient because expenses such as marketing, R&D, and administrative overhead increased.
Earnings Per Share
Revenue trends explain a company’s historical growth, but the long-term change in earnings per share (EPS) points to the profitability of that growth – for example, a company could inflate its sales through excessive spending on advertising and promotions.
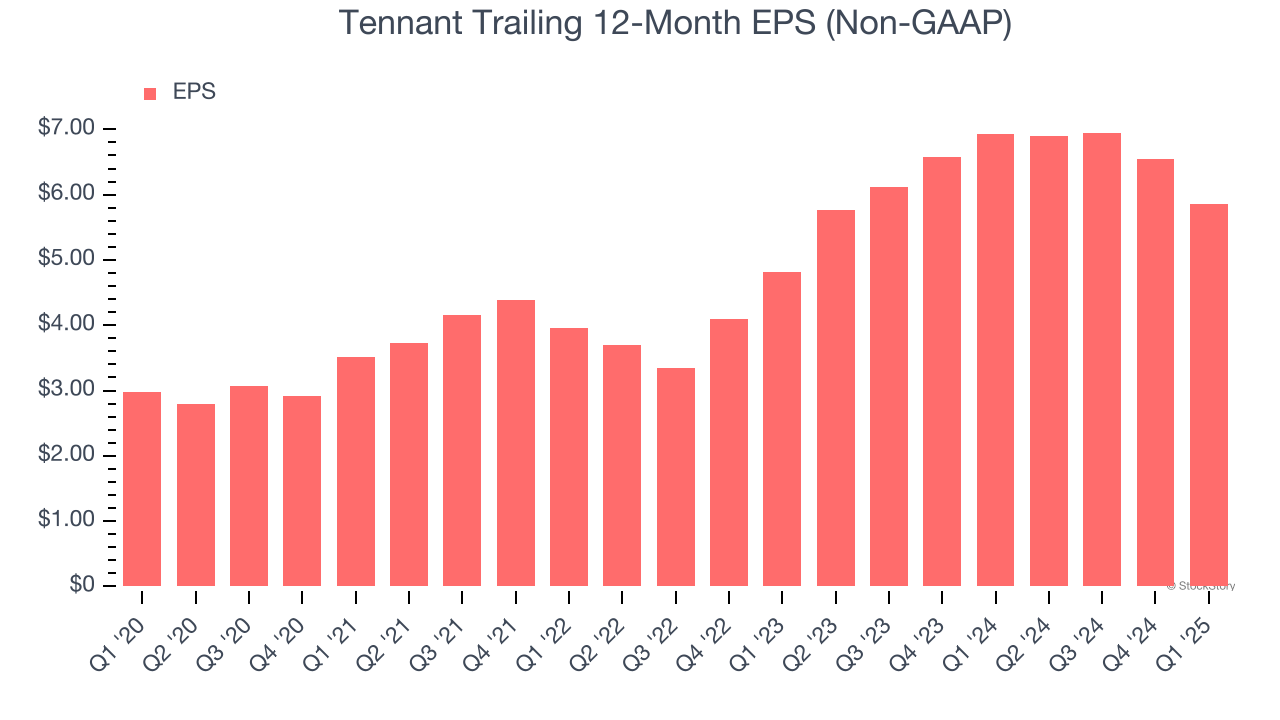
Tennant’s EPS grew at a remarkable 14.6% compounded annual growth rate over the last five years, higher than its 2.3% annualized revenue growth. However, we take this with a grain of salt because its operating margin didn’t expand and it didn’t repurchase its shares, meaning the delta came from reduced interest expenses or taxes.
Like with revenue, we analyze EPS over a shorter period to see if we are missing a change in the business.
For Tennant, its two-year annual EPS growth of 10.3% was lower than its five-year trend. We still think its growth was good and hope it can accelerate in the future.
In Q1, Tennant reported EPS at $1.12, down from $1.81 in the same quarter last year. This print missed analysts’ estimates, but we care more about long-term EPS growth than short-term movements. Over the next 12 months, Wall Street expects Tennant’s full-year EPS of $5.86 to grow 5.9%.
Key Takeaways from Tennant’s Q1 Results
We struggled to find many positives in these results. Its revenue missed significantly and its EBITDA fell short of Wall Street’s estimates. Overall, this was a weaker quarter. The stock remained flat at $72.16 immediately after reporting.
Should you buy the stock or not? If you’re making that decision, you should consider the bigger picture of valuation, business qualities, as well as the latest earnings. We cover that in our actionable full research report which you can read here, it’s free.